|
Data for Enzyme Lab Report. |
|||||||||||||||||||||||||||||||||||||||||||||||||||||||||||||||
|
Well, Devin and I stuck around after lab and ran this sucker again. The results are puzzling, at best. (Actually puzzling usually is best because it means you might actually learn something if you figure it out!) As you recall, we expected to see color develop (and absorbance increase) over time, because catechol (the reactant) would convert to benzoquinone (the product), which should absorb light at 470 nm. This reaction is catalyzed by catechol oxidase, an enzyme present in potato extract. We expected the product to develop faster at higher temperature, up to a point. Above some optimal temperature, the rate should decrease as the enzyme is distorted or denatured by heat. Methods The enzyme solution was approximately 20 grams of potato in 5 L of water (0.4%). The substrate solution was 1% catechol in water. We set out to measure the rate of the reaction (V) as a function of temperature. We prepared 3
solutions in spectrophotometer cuvettes: 2. Control 1: 3 ml enzyme and 3 ml water (no substrate). 3. Control 2: 3 ml substrate and 3 ml water (no enzyme). The tests were run at 4 temperatures; 4C (ice bath), 27C (room temp), 40C (water bath), and 80C (watrer bath). The solutions were placed at the test temperature for 5 minutes before mixing the enzyme and substrate, and were kept at the test temperatures when not making readings in the spectrophotometer. The controls were kept at room temperature (this was a short-cut- we really should have had controls at each temperature). Optical absorbance at 470 nm was measured using a Spectronic 20. Absorbance was read just after mixing the enzyme and substrate (time zero) and at 5 minute intervals thereafter.
|
|||||||||||||||||||||||||||||||||||||||||||||||||||||||||||||||
|
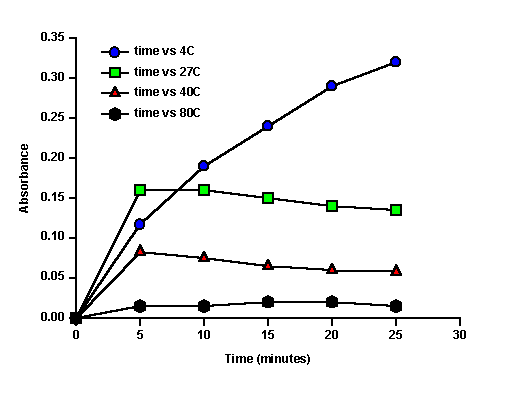
Results As you will see below, the results weren't quite what we expected! At 4C, absorbance increased with time, but the rate of increase (the slope of the line) decreased with time (Figure 1). The higher temperatures gave very different results! After an initial increase, the reaction stopped- absorbance either remained stable or decreased slightly after 5 minutes. In addition to a graph like Figure 1, you should also prepare a graph of reaction velocity (V) vs temperature. Unfortunately, there really isn't any period of constant velocity (slope) in these results. Ideally, the product concentration would have increased steadily, but something apparently inhibited the reaction, slowly at 4C, faster at the higher temperatures. Still, its worth making a graph. Use the initial slope (0-5 minutes) as an estimate of V and plot V vs temperature. It will show that the rate was apparently fastest initially at 27C. (But I'll bet it had started faster, and then slowed down before 5 min at 40C!)
Table 1. Optical absorbance versus time.
|
|||||||||||||||||||||||||||||||||||||||||||||||||||||||||||||||
Figure 1. Optical absorbance versus time for the reaction mixtures. (Note: I subtracted the absorbance at time zero from each reading, so that the lines would start at zero. I did not graph the controls).
Discussion These data are not what we expected, but they present an excellent opportunity for analytical thinking. I've come up with a testable hypothesis to explain the observations. I'd like you to do the same. Here are the relevant facts: 1. The reaction we studied is: 2. The reaction mixtures contained potato cells. 3. Cells consume oxygen, and consume it faster at higher temperatures. 4. There isn't much oxygen dissolved in water, (which is why you have to aerate an aquarium -are you getting my drift here?) In your discussion, tell what results you expected, and explain clearly how these results differed. Then propose a testable hypothesis to explain the observed results, and suggest a simple experiment to test it. This will be lots more interesting than just seeing that reactions go faster at higher temperatures!
|
|||||||||||||||||||||||||||||||||||||||||||||||||||||||||||||||
|
About the lab reports The pages at the back of the lab manual give you general instructions for preparing your report. The same information is on this link. Do type it, and try to use Excel or some other program to make your graphs if possible. However, graphs neatly done by hand (using graph paper) are acceptable too.
|
|||||||||||||||||||||||||||||||||||||||||||||||||||||||||||||||
|
|
|||||||||||||||||||||||||||||||||||||||||||||||||||||||||||||||
