Heavy Metal Concentrations in the
James River:
Outside of Metropolitan Drainage vs. Abandoned Zinc Mine Drainage and
Metropolitan Drainage
Geology 581: Geochemical Techniques
Dr. Mantei
Research by: DJ Wurglitsh
Abstract:
The concentrations of lead, copper, zinc, and phosphorous were determined in the sediments along the course of the James River in Southwest Missouri via ICP analysis. The control group was just upstream of the states third largest city of Springfield, whereas the second test group collected at the intersection of Pearson Creek which drains out of a small city and runs most of its course along agricultural areas. The third sample area was just downstream of Springfield and included sampling areas just off the banks of a newly built golf course. Samples were taken with restricted grain size and HNO3 was used to adsorb the metals from the sediments themselves. Once the metal concentrations were in the HNO3, samples underwent ICP analysis to test for the Pb, Cu, Zn, and P element concentrations in ppm.
Results showed that the Pearson Creek test group had an overall mean concentration of zinc 8.5 times greater than that of the controls zinc concentration in ppm. This is largely due to the factor of abandoned zinc mines along the banks of Pearson Creek. The downstream of Springfield test samples showed high levels of lead and phosphorous compared to that of the control. This is likely caused by the urbanization factors of the city of Springfield.
Table of Contents:
Introduction… Page 1
Location and
Geology… Page 1
-Map 1A: (Entire Sampling Area)… Page 2
-Map 1B: (Control and Pearson Sampling Area)… Page 3
-Map 1C: (Downstream of Springfield Sampling Area)… Page 4
Sampling Procedures… Page 4
Lab Procedure… Page 5
Results… Page 7
-Table 1: (Sample Site Element Concentrations)… Page 7
-Table 2: (Mean Element Concentrations)… Page 8
--Figure 1A: (Mean Element Concentrations)… Page 8
--Figure 1B: (Control vs Pearson
Test Mean Element Concentrations)… Page
9
--Figure 1C: (Control vs Downstream
of Springfield Mean Element Concentrations)… Page 9
-Table 3: (t-Test Assuming Unequal Variance Results)… Page 11
--Figure 2A: (Control vs Pearson
Test Pb/Cu Concentrations)… Page 11
--Figure 2B: (Control vs Downstream
of Springfield Test Pb/Cu Concentrations)… Page 11
--Figure 3A: (Control vs Pearson
Test Zn/P Concentrations)… Page 12
--Figure 3B: (Control vs Downstream
of Springfield Zn/P Concentrations)… Page 12
--Figure 4: (pH values at Sample Sites)… Page 12
Discussion… Page 13
Introduction
A plethora of studies reported in scientific literature have shown how heavy metals that have been adsorbed or precipitated in river and stream sediments are due largely to contamination anthropogenic dispersion sources such as cities and landfills. Mantei and Coonrod (1989), Mantei and Foster (1991), and Mantei and Sappington (1994) are examples that proved stream sediment contamination was by sources such as landfills. There is a multitude of reasons why stream sediment can be contaminated. Such things as agricultural, sewer/septic, and city runoff can all accumulate to higher heavy metal contamination levels.
Location and Geology
This study tests heavy metal contamination in the forms of Pb, Zn, Cu, and P. Four different areas of sampling were taken, all of which were on the James River in Greene County. The first area of sampling (J1-J8, See Map 1A NE corner, and Map 1B) included the James River before it is joined with Pearson Creek 2 miles east of Springfield, Missouri. The second area of sampling (JP1-JP7, See Map 1A just SW of J1-J8, and Map 1B) included the intersection of the James River and Pearson Creek. Pearson Creek drains out of the Springfield Metropolitan city of Strafford, Missouri and runs along mostly agricultural areas on its course towards the James River. It is also very important to note that abandoned zinc mines run along the Pearson. Used heavily in the late 1800’s this mines have been abandoned for almost a century. The third study area (SP16-SP22, See Map 1A SW corner, and see Map 1C) is 11 miles downstream of the first study area of study. These sample sites as well as the fourth area’s samples (SP23-SP28, See Map 1A SW corner, and see Map 1C) are all downstream of Springfield, Missouri and are less than 2 miles north of Nixa, Missouri another Springfield Metropolitan city. The fourth area of sampling is just half a mile downstream of the third sampling area and is located along the Rivercut Golf Course in Greene County.
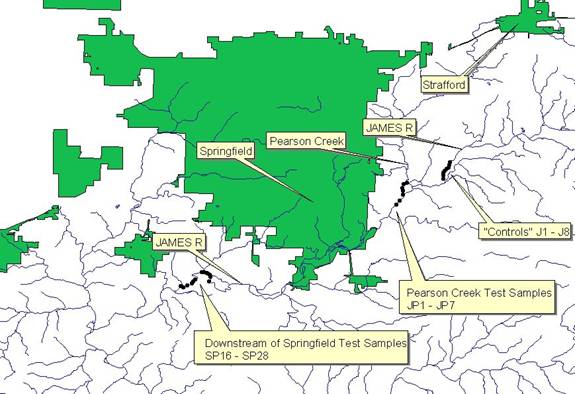
MAP 1A: The entire study area, inside Greene County, Southwest Missouri
Sites J1-J8 are just upstream of Pearson Creek and Springfield, Missouri and were tested as the control. JP1-JP7 was sampled starting exactly on the James River and Pearson Creek intersection. The Pearson Creek incorporates runoff from the small town of Strafford, Missouri (approximate population 1,166), and along its way to the James River has agricultural areas on its banks. The final two sample sites are just north of Nixa, Missouri and downstream of Springfield, Missouri (approximate population 150,000). This sample area is just upstream of the Wilson’s Creek intersection of the James River, where most of Springfield’s runoff/contamination occurs. These sites were chosen to show immediate results and test for any significant changes in heavy metal concentrations from the fourth sample site (SP23-SP28) just off of Rivercut Golf Course.
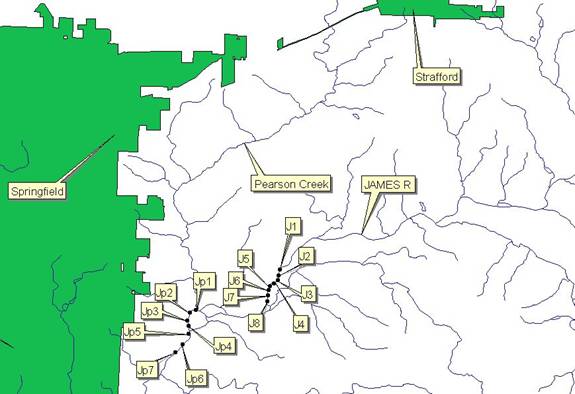
MAP 1B: Control Sample
Site as well as Pearson Creek Test Sample Site – Pearson
Creek drains Strafford,
Missouri and along its course towards the James
River runs along agricultural
areas on both sides of its banks.
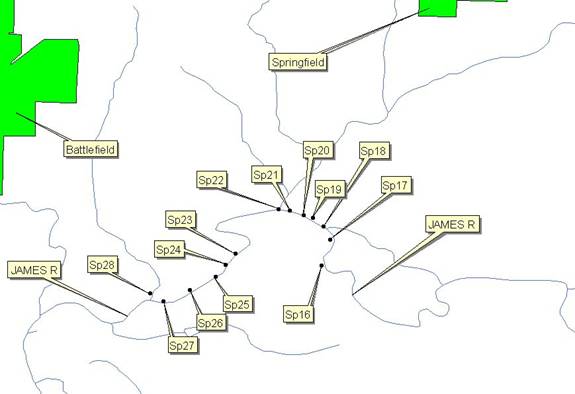
Map 1C: The Downstream of
Springfield Test Sample Sites along the James River.
The geology of the area includes Mississippian aged Formations. Two series, the Kinderhookian and Osagean all contain formations composed mostly of limestone. The Osagean Series is composed of the three limestone formations the Burlington, Elsey, and the Pierson. The Kinderhookian Series is composed of the Compton formation and the other formation is the Northview Shale/Silt belonging to the series. Overall the area rests upon the Ozark Plateau.
Sampling Procedures
Twenty-eight samples were taken along the James in four different groups. The first group (J1-J8 controls) was taken upstream of Pearson Creek, the city of Springfield, and Rivercut Golf Course. They were sampled at intervals of 600 ft downstream nearest the center of the stream as possible. The second sampling site (1.4 miles downstream of J8) included sample JP1 which is where the Pearson exactly junctions with the James River. The third sampling area was taken downstream of Springfield, Missouri. Each site (SP16-SP22) was taken at intervals of every 500 ft. The fourth sampling area was taken 0.5 miles downstream of sample site SP22 alongside the banks of Rivercut Golf Course. These sites were also sampled at 500 ft intervals along the James River.
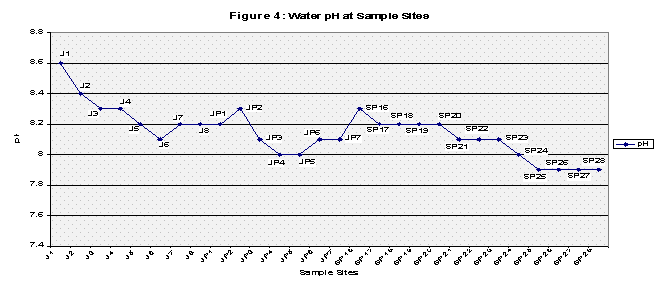
At each sampling site, a GPS device was used to take exact coordinates of the sampling site, and then a pH meter took the pH of the water. After these procedures were taken, sediments were scooped from the stream and sieved at a 170-230 mesh grain size interval (very fine sand). Each sample was placed in a tube and labeled accordingly.
Lab Procedures
When the samples arrived in the lab, each sample was placed into an appropriately labeled beaker. Each sample was allowed time to settle so as the excess water could be poured off. With most of the excess water being poured off, each beaker was placed in the oven over night to further evaporate any remaining water in the samples. Each dried sample was then taken out and exactly 1 gram of pure dry sediment was weighed out on an analytical balance. After each sample was weighed to exactly 1 gram of dry sediment the sample was placed back into an appropriately labeled centrifuge tube.
After every sample was placed into centrifuge tubes 20 ml of 3N HNO3 was added to each sample. The 20 ml of 3N HNO3 dissolves the metal concentrations from the dry sediment and precipitates it into the liquid acid. Once the 20 ml of 3N HNO3 was added, each centrifuge tube was placed into a hot water bath for 20 hours at 80°C. This helps to further dissolve any metals away from the sediment and into the acid solution. When each sample was removed from the hot water bath, they were then placed into the centrifuge and set to spin at the maximum rpm for 3 minutes each. This allows the sediment and acid solution to further settle so that the liquid acid solution can be poured out without any sediment being poured into the final tube. Each sample was poured into appropriately labeled tubes for chemical analysis by the ICP.
Before the chemical analysis, three standards were made as well as a blank standard. The four metals that we tested for were lead, copper, phosphorous, and zinc, so each standard excluding the blank consisted of each metal by transferring the appropriate amount via a micropipette. The first standard was composed of 2 ppm lead, copper, phosphorous, and zinc in a solution of 3N HNO3. The second was made of 5 ppm lead, copper, phosphorous, and zinc, and the third standard was made of 10 ppm lead, copper, phosphorous, and zinc.
When the standards were prepared normal ICP startup procedures were done to insure safe and effective use. The three standards were then tested to see if they were indeed at the appropriate metal concentrations, before testing the samples could begin. After each standard was tested and proven to be at the precise levels of metal concentration, each sample was then tested in condescending order (See Table 1 for results).
Results
(See Table 1 for the sample size metal concentrations in ppm as well as each
samples tested pH value.)
|
Table 1: Sample Site Element
Concentrations (ppm) and pH Values for Sediment Samples taken along the James River |
|||||
|
|
|
||||
|
|
|
|
|
|
|
|
|
Pb ppm |
Cu ppm |
Zn ppm |
P ppm |
pH |
|
J1 |
209.8 |
18.9 |
55.6 |
237.4 |
8.6 |
|
J2 |
33.1 |
16.9 |
40.1 |
191.7 |
8.4 |
|
J3 |
44.5 |
30.2 |
65.8 |
244.2 |
8.3 |
|
J4 |
32.9 |
17.6 |
43.8 |
207.4 |
8.3 |
|
J5 |
24.6 |
20.7 |
37.3 |
160.9 |
8.2 |
|
J6 |
21.9 |
23.2 |
32.1 |
172.5 |
8.1 |
|
J7 |
36.1 |
58.5 |
55.4 |
224.2 |
8.2 |
|
J8 |
30.8 |
29.6 |
40.7 |
211.1 |
8.2 |
|
JP1 |
70.7 |
28.1 |
439.8 |
249.2 |
8.2 |
|
JP2 |
93.3 |
57.4 |
409.8 |
147.1 |
8.3 |
|
JP3 |
51.2 |
21.1 |
288.4 |
250.2 |
8.1 |
|
JP4 |
73.6 |
46.4 |
492.6 |
285.8 |
8 |
|
JP5 |
61.1 |
39.3 |
440.8 |
327.8 |
8 |
|
JP6 |
58.1 |
42.9 |
325.2 |
258.4 |
8.1 |
|
JP7 |
61.1 |
60.7 |
350.6 |
273.1 |
8.1 |
|
SP16 |
44.18 |
71.44 |
136.66 |
441.6 |
8.3 |
|
SP17 |
42.38 |
56.7 |
132.92 |
398.6 |
8.2 |
|
SP18 |
46.68 |
28.68 |
97.76 |
237 |
8.2 |
|
SP19 |
35.36 |
24.12 |
62.82 |
154.62 |
8.2 |
|
SP20 |
33.42 |
69.66 |
85.58 |
274 |
8.2 |
|
SP21 |
36.42 |
85.82 |
112.14 |
427.8 |
8.1 |
|
SP22 |
40.64 |
41.96 |
91.24 |
265.2 |
8.1 |
|
SP23 |
32.68 |
34.1 |
90.66 |
220.6 |
8.1 |
|
SP24 |
20.7 |
44.32 |
74.68 |
222 |
8 |
|
SP25 |
33.3 |
38.4 |
90 |
242.2 |
7.9 |
|
SP26 |
34.5 |
29.1 |
62.42 |
181.5 |
7.9 |
|
SP27 |
30.26 |
47.02 |
83.2 |
264.6 |
7.9 |
|
SP28 |
44.86 |
29.52 |
48.38 |
209.2 |
7.9 |
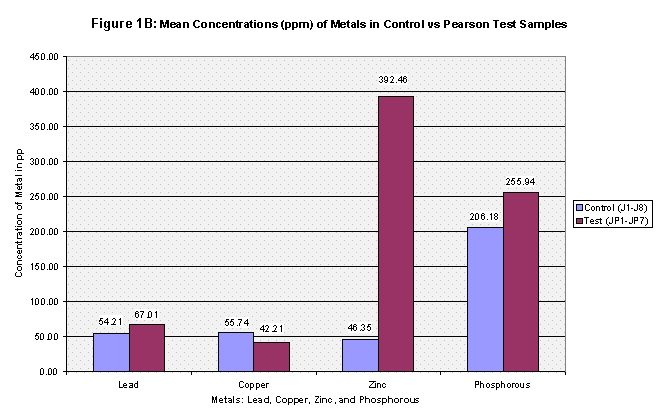
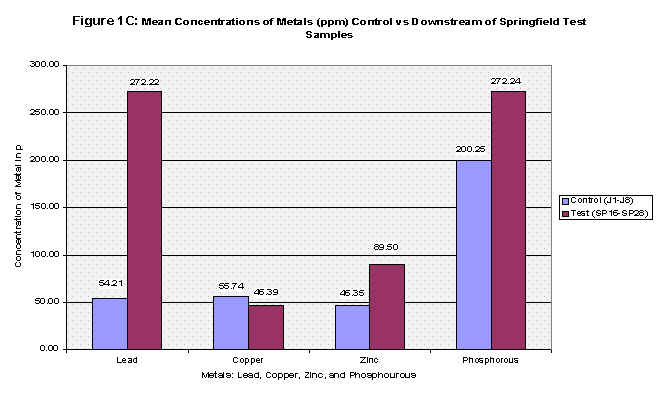
Once again, the samples were broken into three groups: J1-J8 were the control, JP1-JP7 were the test group that were sampled at the intersection of Pearson Creek and James River, and the final group SP16-SP28 were the samples taken downstream of Springfield, Missouri. (SP16-SP22 just before Rivercut Golf Course and SP23-SP28 on the banks of the James River and Rivercut Golf Course). The control group was tested once against the Pearson Test Samples, and once again against the Downstream of Springfield Test Samples.
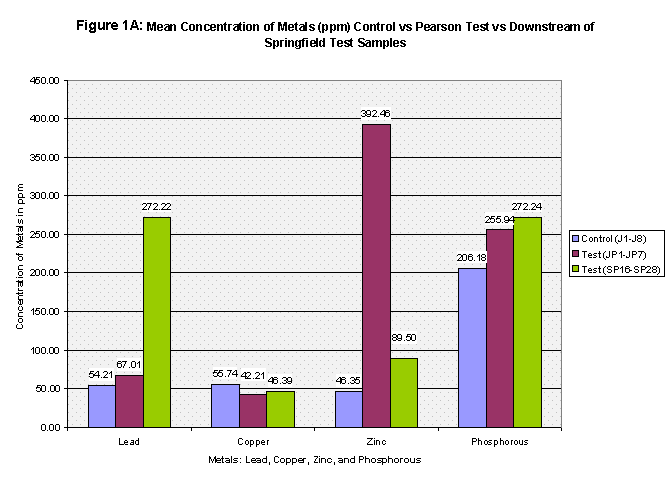
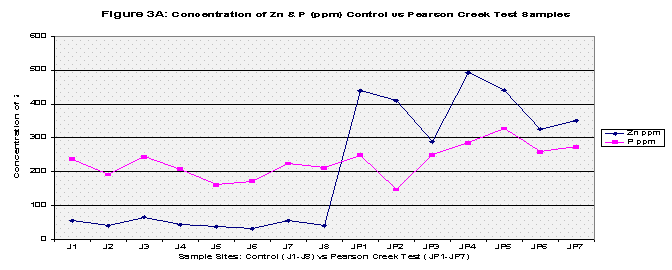
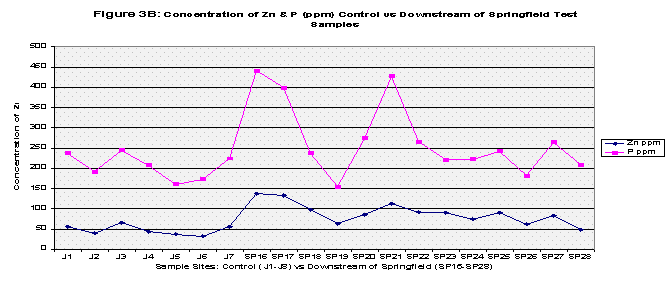
The mean concentrations of the four metals tested were then computed for all three groups: the control, Pearson test, and Downstream of Springfield test (Refer to Table 2, Figure 1A, Figure 1B, and Figure 1C). Next, each group was t-Tested at two confidence levels: 5% and 1% Alpha. The first t-Test was at 5% Alpha, and all the metals passed except for zinc in the control versus Pearson Test Samples and control versus Downstream of Springfield Test Samples. At the 1% Alpha t-Test, all the metals failed except for lead in the control versus Pearson Test Samples and control versus Downstream of Springfield Test Samples. (Refer to Table 3).
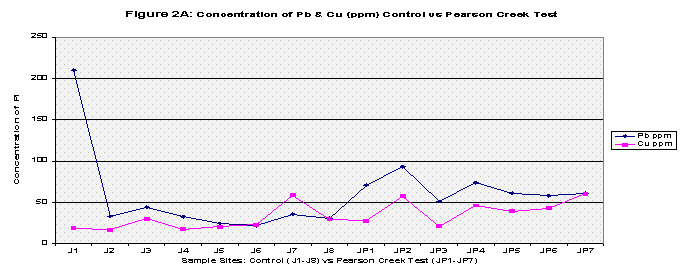
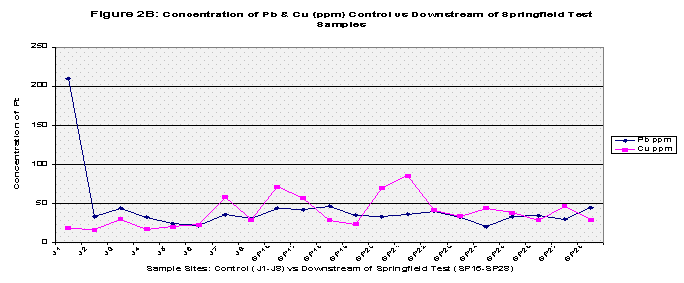
Finally all the elements were graphed to show any trends, this was also to include pH values. Each graph compared the control versus the Pearson and the Downstream of Springfield test samples in two categories: Copper and Lead (because of their similar concentrations) and Zinc and Phosphorous (Refer to Figures 2A, 2B, 3A, 3B, and Figure 4 for pH values).
|
Table 2: |
|
|
|
Mean Concentration (ppm) of the metals in
the sediments along
the stream. |
||
|
Metal: |
Control (J1-J8) |
Test (JP1-JP7) |
|
Lead |
54.21 |
67.01 |
|
Copper |
55.74 |
42.21 |
|
Zinc |
46.35 |
392.46 |
|
Phosphorous |
206.18 |
255.94 |
|
|
|
|
|
Metal: |
Control (J1-J8) |
Test (SP16-SP28) |
|
Lead |
54.21 |
272.22 |
|
Copper |
55.74 |
46.39 |
|
Zinc |
46.35 |
89.50 |
|
Phosphorous |
200.25 |
272.24 |
|
Table 3:
t-Test Assuming
Unequal Variance |
|
|
|
|
|
Control: (J1-J8) Pearson Test: (JP1-JP7) Downstream of Springfield
Test: (SP16-SP28) |
||||
|
|
|
|
|
|
|
t-Test at 5%
Alpha |
|
|
|
|
|
|
Pb |
Cu |
Zn |
P |
|
Control vs Pearson Test
Samples |
Passed |
Passed |
Failed |
Passed |
|
Control vs Downstream
of Springfield Test Samples |
Passed |
Passed |
Failed |
Passed |
|
|
|
|
|
|
|
t-Test at 1% Alpha |
|
|
|
|
|
|
Pb |
Cu |
Zn |
P |
|
Control vs Pearson Test
Samples |
Passed |
Failed |
Failed |
Failed |
|
Control vs Downstream
of Springfield Test Samples |
Passed |
Failed |
Failed |
Failed |
Discussion
From the results, the control and Pearson test samples yielded very similar concentrations of lead and copper. Both lead and copper were under 70 ppm whereas zinc and phosphorous levels ranged more chaotically. The control samples gave a mean concentration of 46.35 ppm of Zinc compared to that of 392.46 ppm in the Pearson test samples. That’s almost equivalent to 8.5 times greater of a zinc concentration. This is due to two factors, the first being that zinc is highly soluble and will be absorbed into stream water/sediment. The second, as mentioned before, there are several abandoned zinc mines that run along the Pearson. As for phosphorous levels, the control group’s mean was 206.8 and the Pearson test samples yielded a slightly higher concentration of 255.94. The test samples collected just downstream of Springfield, Missouri yielded different results. Springfield runoff may have increased the Cu and Pb concentrations due to things like corrosion of copper and lead pipes that lay underground. Whereas both the control and Pearson test samples yielded lead concentrations less than 70 ppm, the downstream of Springfield test group’s mean was 272.22 which is 5 times greater than the control’s mean. Copper concentrations were similar as to both the control and the Pearson test samples, and zinc all though higher (SP average: 89.50) reached nowhere near that of the Pearson test samples. Phosphorous levels were very similar to that of both the Pearson test samples and the control reaching 272.24 (See Table 2, Fig 1A, 1B, and 1C for further mean concentration results).
It is important to note that the control samples were taken away from any major towns or cities as well as away from both roads and residential areas. The Pearson test group ran along an outside city limit farm road but it is more important to note that the Pearson drains the Springfield metropolitan city of Strafford and runs along agricultural land on both sides of its banks at times. The downstream of Springfield test samples ran along a road that was under construction as well as a small residential area. The final downstream of Springfield samples (SP23-SP28) were collected along Rivercut Golf Course which is only five years in age. On the other side of the James River banks were limestone bluffs which may contribute to the overall neutralizing trend in pH values away from the control samples (See Fig 4).
References Cited:
Mantei, E, J. and Foster, M, V, 1991, Heavy Metals in Stream Sediments: Effects of
Human Activities, v 18, no. 2, p. 95-104
Mantei, E, J. and Coonrod, D, L, 1989, Heavy Metal Content in the Stream Sediments
Adjacent to a Sanitary Landfill, v 13, no. 1, p. 51-58
Mantei, E, J. and Sappington, E, J, 1994, Heavy metal concentrations in sediments of
streams affected by a sanitary landfill: A comparison of metal enrichment in two size
sediment fractions, v 24, p 287-293
Mantei, E, J, Ernst R, L, and Zhou, Y, 1993, Comparison of metal homogeneity in grab,
quartered, and crushed-sieved portions of stream sediments and metal content change of
resulting from crushing- sieving activity, v 22, p. 186-190
Mantei, E, J, Guiterrez, M, and Zhou, Y, 1996, Use of normalized metal concentrations in
the Mn oxides/hydrous oxides extraction phase of stream sediments to enhance the
difference between a landfill emission plume and background, v 11, p. 803-810