Introduction
There are various industrial
activities along the Jordan
Creek area in the
downtown area of Springfield,
Missouri. Metal concentrations from this activity could
be draining into Jordan
Creek and concentrating
in the drainage sediments. There are
various studies which have used stream sediments to determine the effects of
emissions from industrial point and non-point sources. In this study, the concentrations of copper,
lead, zinc, cadmium nickel, phosphorous, arsenic, silver and chromium in the
sediments of Jordan
Creek were
determined. The concentrations of these
elements in the sediments from the north branch of the stream were compared to
those downstream in the more industrialized area along the stream. This study was initiated and completed by the
Geochemical Techniques class (GLG 581) in the Department of Geography, Geology
and Planning at Southwest
Missouri State
University during the
Spring Semester of 2003.
Procedure
Collection of
Samples
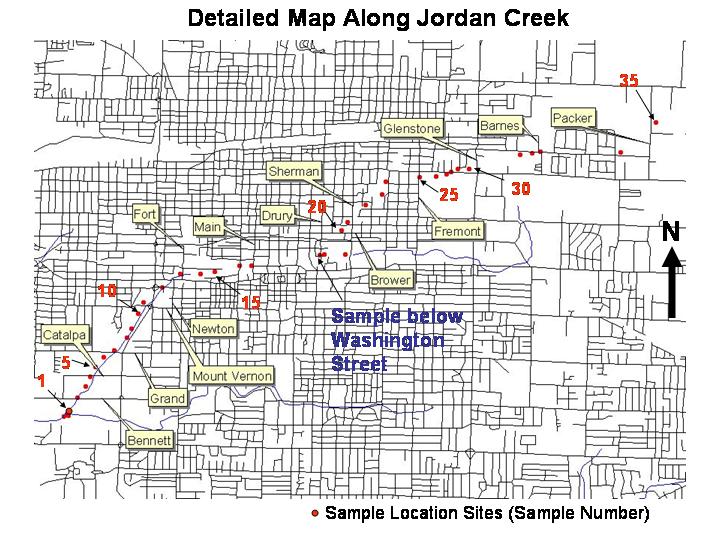
Thirty five drainage sediment samples
were collected along Jordan
Creek. The samples were numbered increasingly from
the mouth to near the head of the stream.
Eighteen samples were collected from the mouth of the Creek to the
stream intersection with Washington
Street. The
sample at the Washington Street
intersection was collected below the surface.
These 18 samples comprised the “Test Samples” in this study since
they were located in the more industrialized area along the stream. The remaining 17 samples collected upstream
comprised the ”Control” in this study.
All drainage samples were collected
within a 3 week period during February to March, 2003. The samples were wet sieved in the stream and
only the coarse silt-fine sand
size fraction was saved for analyses in small labeled bottles. The pH of the water was taken at each
collection site. To obtain accurate
locations of each sample site a GPS unit was used. The
sample locations were plotted on maps using GIS.
Physical and
Chemical Preparation of the Samples and Chemical Analyses
The following procedures to
prepare samples for chemical analyses are those used often in other
researches;
All samples were taken to the lab and added to beakers containing double
de-ionized water, swirled and the unwanted suspended finer sediment discarded
to further purify the desired sediment fraction size. The samples were dried. A 1.000 gram portion of each sample was
placed in a labeled centrifuge bottle to which 20 milliliters of acid was
added. The acid was comprised of 3N
nitric and 0.5 hydrochloric. The samples
were placed in a hot shaker bath at 80 degrees C for 24 hours. The samples were then centrifuged and the
aqueous portion of each was added to labeled analyses bottles.
Appropriate standards and a blank
solution were prepared for chemical analysis.
The ICP machine was programmed and the concentrations of each element in
the study were ascertained.
Results
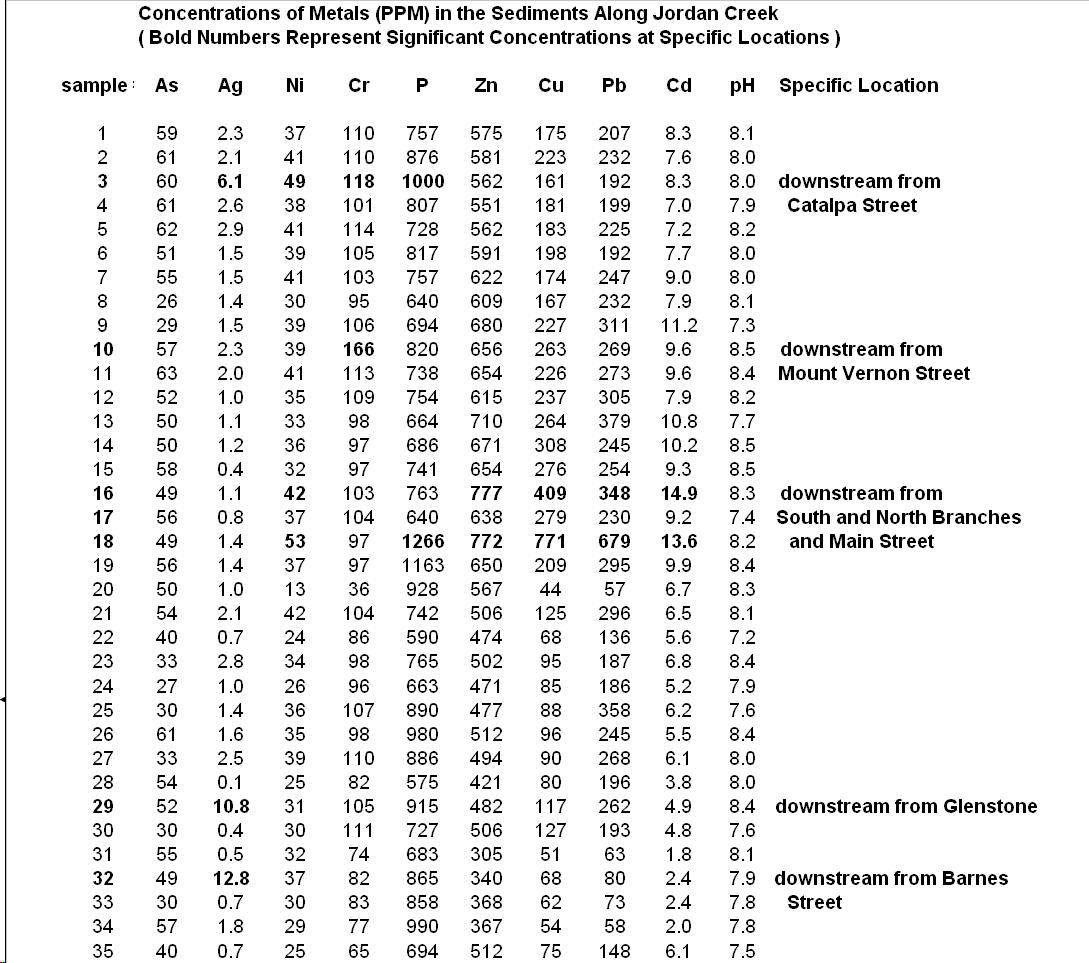
Click here to see a table representing the individual
concentrations of all the elements in all the test and control samples. Also included is the pH of the stream water
at each sample site. Significant
concentrations at specific locations along the stream are shown in bold type.
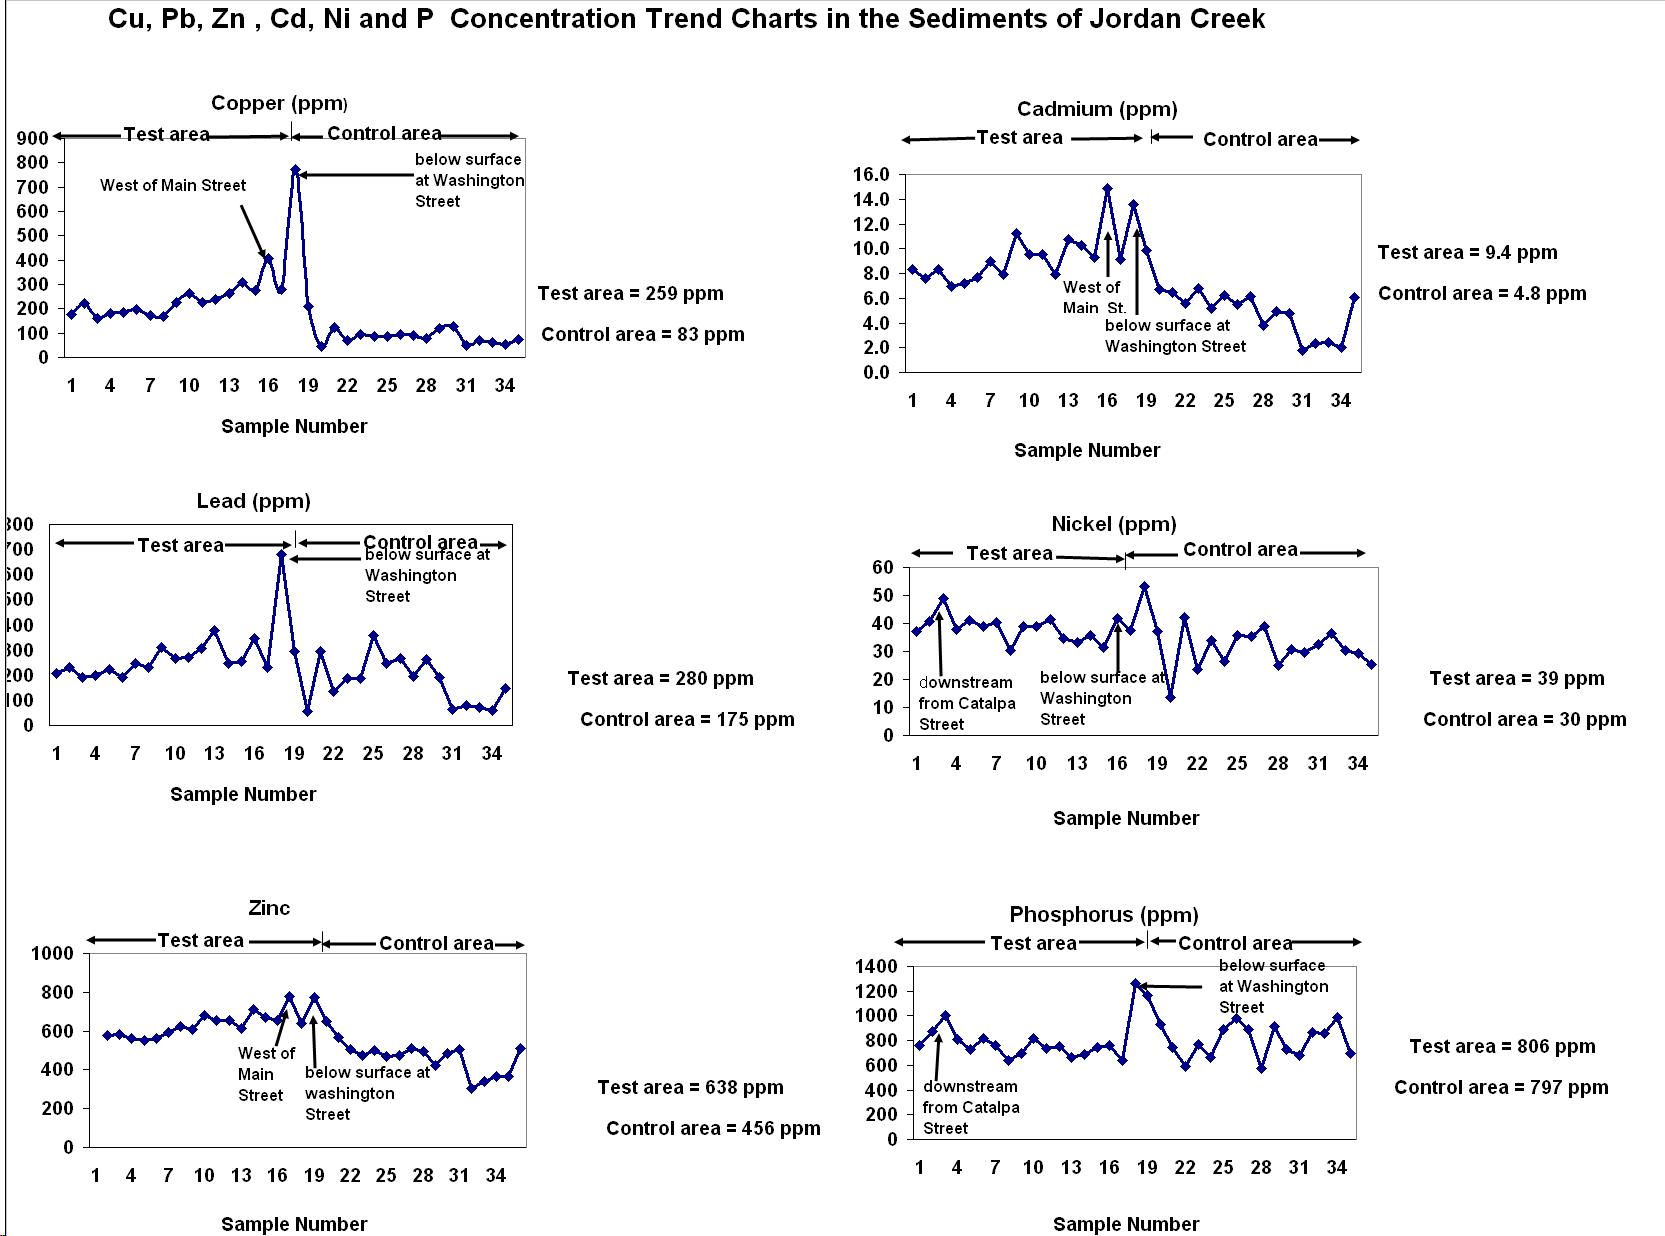
Trend charts for the concentrations of
each element in the sediments along the stream course were prepared. The concentrations trends for Cu,
Pb, Zn, Cd, Ni and P are shown. Mean element concentrations in the
sediments of the Test and Control Samples are shown to the right of the trend
charts. The mean concentrations of Cu,
Pb, Zn, Cd, Ni and P are higher in the Test Samples (samples 19-1) than in the
Control Samples (samples 20-35). However, the mean concentration of P is only
slightly higher. The concentrations of all 6 elements peak at samples 18 and 19
and would seem to represent an area of higher industrial activity. Samples 18 and 19 were collected near the
confluence of the north and south branches of Jordan Creek.
Sample # 18 was collected in the tunnel below Washington Street. Cadmium, Zn and to a
lesser degree Pb concentrations show an increase trend in the North Branch
downstream to the confluence. This could reflect emissions from increasing
industrial activity from the upper area of the North Branch Jordan to the
confluence. The Cu, Pb, Zn and Cd concentrations show a decreasing trend
downstream from the peaked area. This
trend would be expected as the concentration of the elements in the sediments
would decrease because of dilution effects.
However, the concentrations of Ni and P do not show this trend. The reason is not clear. Possibly, there is a
continual emission of these elements from other sources downstream. The high
concentrations in the drainage sediments located around the Washington Street and Main Street areas could be from emissions
from activities by metal recycling, electrical and refrigeration
companies.
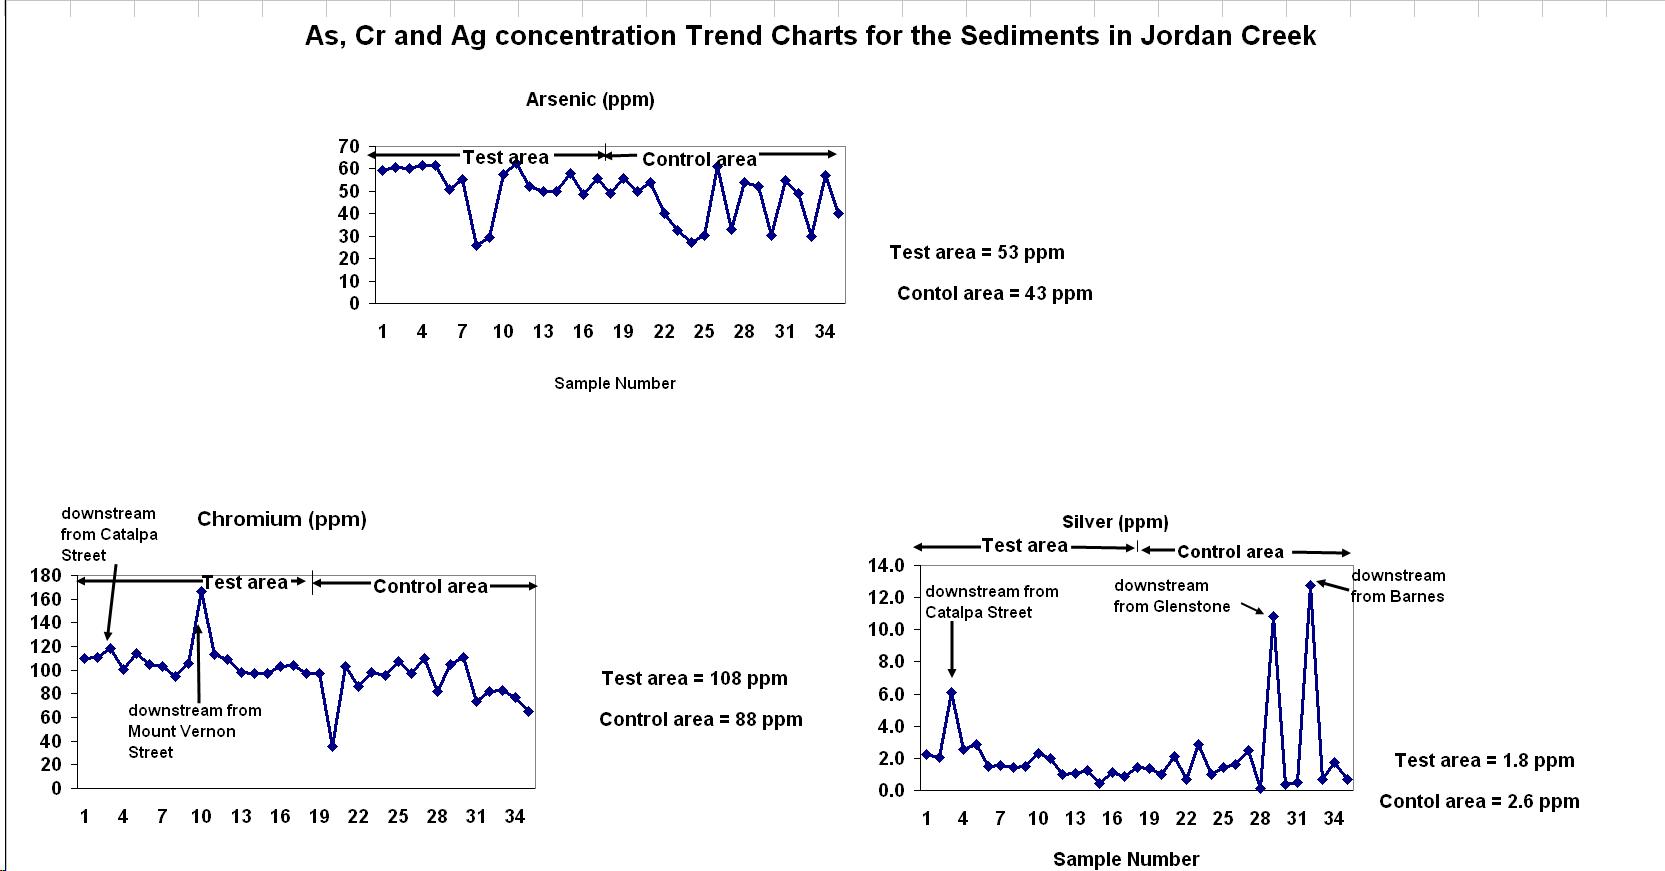
Trend
charts for the concentrations of As, Cr and Ag are shown. These elements do not show peaked
concentrations at Samples 18-19 as those on Page 6. The mean concentrations of the Test and
Control Samples for each metal are shown to the right of each trend chart. The concentration of As and Cr are slightly
higher in the Test Samples as compared with the same in the Control
Samples. The concentration of Ag is
higher in the Control Samples because of the presence of 2 significant peaks.
Interesting element concentration peaks
in the sediments occur along the stream.
Near Mount Vernon Street
a significant Cr peak occurs in one sample downstream from a printing company
and a large lumber supply business. It
was noted that during the collection of the sample an orange leach- ate-like
material was observed oozing into the stream.
Immediately downstream from Catalpa
Street, there appears to be small concentration
peaks of P and Cr and larger peaks of Ni and Ag. These samples were located downstream from a
metal recycling company. Two very high concentration
peaks for Ag exist in the Control area. One peak is located downstream from Barnes Street and
the other downstream from Glenstone
Street. The
emission source for silver could be from a solvents and chemical manufacturing
company located upstream from these sample sites.
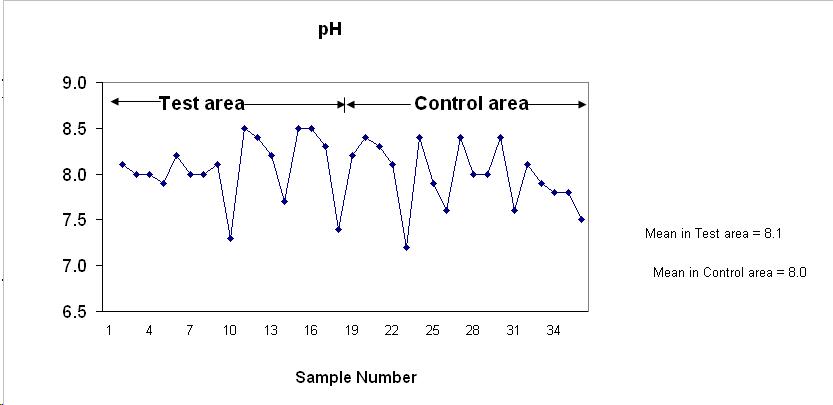
The trends of element concentrations along
the stream could be affected by the variance of the pH of the stream
water. The pH values of the water along Jordan Creek
at the collection sites are shown in a table. The trend of the pH values along the stream
course and the mean concentration of the pH in the Test and Control Areas are
shown below. The trend patterns for the
pH along the stream would not explain the trend pattern for the element
concentrations. Also, the mean pH is
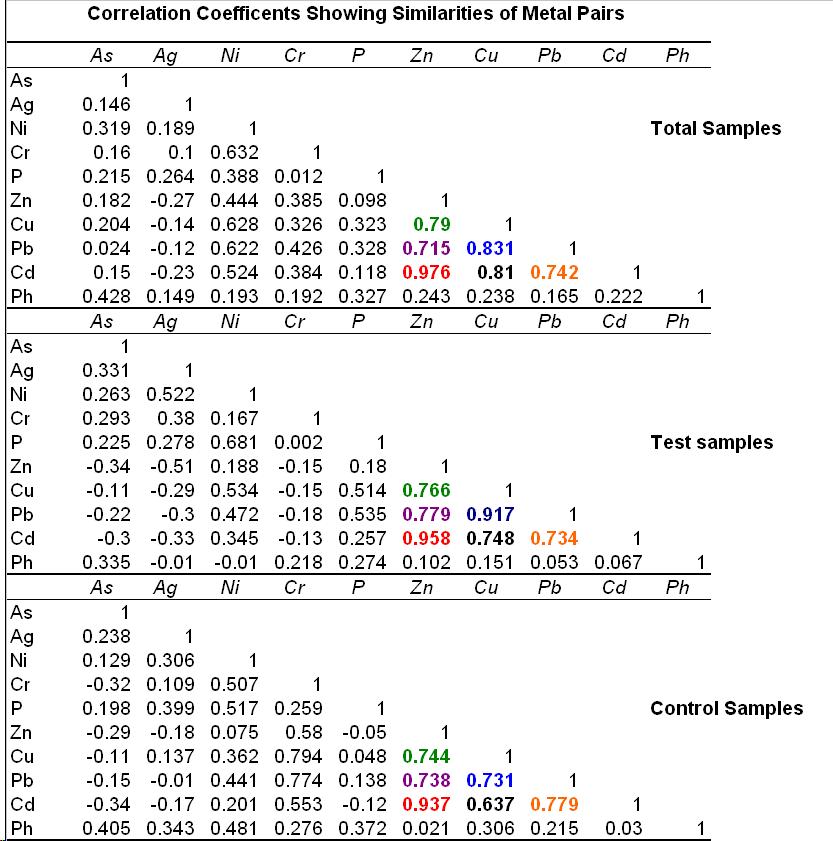
very similar in both the Test and Control Areas. In addition, the correlation coefficient tables
indicate there is no dependency of element concentration on pH
According to the correlation coefficient
tables there seems to be a high correlation between concentrations of Cu,
Pb, Zn and Cd. An especially high
correlation exists between Zn and Cd.
The high correlations between the 4 elements are present in the Test and
Control Samples. A reason for this
dependency between the 4 elements could be that they share a common type of
emission source in both the Test and Control Areas. As mentioned before activities of metal
recycling and electrical and supply companies could be the emission source.
Element Concentrations in the Sediments of Jordan Compared
to Other Local Streams
This table compares
the element concentrations in this study with that of other local streams. The concentrations of the elements in
sediments from other streams were taken from studies by other researches.
The mean element concentrations in the drainage
sediments in the Test (downstream from Washington Street) and Control samples
(upstream from Washington Street)
in Jordan Creek are substantially higher than the
same in the sediments of other local streams.
The only element which is similar is the P in Wilson’s Creek.
Toxic Concentrations or Preliminary
Remediation Goals (PRG)
The EPA has not established safe levels for elements in stream
sediments. However, they have done so
for soils. If the same PRG’s values for
elements in soils were applied to stream sediments, some of the concentrations
of elements in this study may be considered toxic or close to toxic. The PRG’s reported for As and Pb are 22 ppm
and 400 ppm, respectively. One lead
sample (Washington Street)
contained over 679 ppm and 2 samples downstream from Main Street contained 379 and 348 ppm.
The mean As concentration in the sediments are well above the 22 ppm
limit. However, the concentrations of As
may be affected by iron interference during the chemical analysis with the ICP
machine. A method to eliminate the
interference is available but was not used because of the time restraints for
the GLG 581 course. It is interesting to
note that just downstream from Main
Street is the area where some fish-kills were
observed. It is known that smaller life
forms which reside at the bottom of the stream may uptake concentrations of
elements from the sediments. Fish, in
turn will consume the smaller life forms and the higher concentrations of
elements possibly causing “a Kill”. There
are other possible reasons for the “kill”.
Conclusion
The drainage sediments in Jordan Creek
appear to be affected by industrial activities along the path of the stream.
Some concentrations of Pb and many for As in the samples may be considered
dangerous.
A further extension of the research on
sediments in Jordan
Creek might include the
determination of the same elements in the South Branch of Jordan Creek. Also, other metals which might be considered
for further studies are Ba, Hg, Fe and Mn.
A study of harmful organics in the sediments may yield some interesting
results.