INTRODUCTION AND HYPOTHESIS
Introduction
Researchers have used different ways to determine the quality of a stream. Stream water, stream sediment and the biodiversity of macroinvertebrates have been used primarily. Certain organic compounds, heavy metals, nitrogen, phosphorous, e-coli bacteria and pH concentrations present in the stream are some factors which can affect the stream quality. Emissions from various industrial facilities located along or near the stream can be the source or cause of these factors.
Many industrial facilities along
Hypothesis
I
believe the heavy metal concentrations in the stream sediments in certain
portions of
PROCEDURE
Stream Sediment Samples
Eleven
The samples bags were opened in my basement and the pH of the sediment water was taken and recorded for each sample using a hand held pH meter. Each sample was allowed to dry completely, disaggregated in a mortar and pestle, passed through a 100 mesh standard sieve and transferred to a labeled bottle.
The samples were taken to a Geology Lab
at
The As, Cu, Pb, Zn, Ag, Cd, P, Cr and Ni concentrations in each sample were determined by using a Varian Induced Couple Plasma (ICP) Machine. Standard solutions of 3 different concentrations of each element was used with a blank solution to help determined the element concentrations. The standards were pre-prepared by the Chemistry Department. Each sample was entered into the ICP machine and data from a printout for each element for each sample was used to calculate the metal concentrations.
Macroinvertebrate Samples
The
locations and trends of heavy metal concentrations in the stream sediments were
observed to establish the collection sites of the macro invertebrate samples. Because
of the cement channelization in some areas along
The sediments and rocks at each collection
site were searched for the different species of macroinvertebrates (bugs). At each site, a picture of the typical bugs
(species) in each of the three classes of pollution tolerant categories was
used to help identify the bug. The
categories of pollution tolerance are Class 1—bugs least tolerant to pollution,
Class 2—bugs moderately tolerant to pollution, and Class 3—bugs pollution
tolerant. Sediments and rock were kicked into a large sieve. The sediment and rocks were searched for the
different bugs present and the first 30 of those observed were recorded. Since
the observation was in the winter, the bugs were not as active, so it was hard
to see the slow moving bugs and it took a longer time.
Organizing Data
A map was made of the research area using Arc-info
and PowerPoint. The sediment sample collection
locations and macroinvertebrate study sites in the more and in the less
industrialized areas along
The poster board of my research was made
for presentation at the
RESULTS
The map
of my research area showing the sediment collection sites and macroinvertebrate
study sites along the

Although sediment stream sediments were collected in cemented channelized and non cemented areas along the stream, the macroinvertebrate were collected in the non cemented channelized (natural channel) areas.
The Data Table is shown below. The table includes the concentration of each element in the sediments along the stream, the mean concentration of each element in both the more industrialized and less industrialized areas along the stream, the pH of the sediment water and the Pollution Tolerance Index of the stream at each of the sediment and macroinvertibrate collection sites.

The mean concentration of each element in the sediments is higher in the more industrialized area than in the less industrialized area along the stream. The concentrations of Ag, Zn, Cu, Pb and Cd are much higher in the more industrialized area. The pH of the sediment water does not change much along the stream. The Pollution Tolerance Index and quality of the stream at the 6 study sites are shown, but will be discussed later in more detail.
The element concentration trends in the
sediments along the stream are shown below. 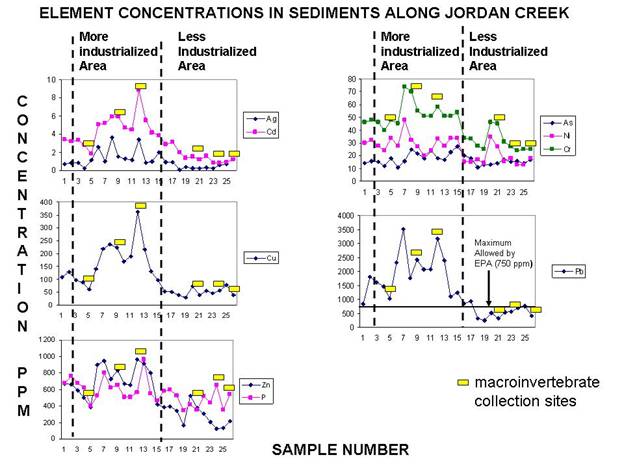
The elements show a much higher concentration in the sediments in the more industrialized portion of the stream. The macroinvertebrate study sites are also shown on each trend chart. The Pb concentrations in the sediments in industrialized portion of the stream are much higher than allowed by the Environmental Protection Agency according to the Preliminary Remediation Goals (P. R G’s). All other elements are below the PRG’s. It may be the high concentrations of lead in the sediments which primarily affects the macroinvertebrate biodiversity in my study.
The detailed macroinvertebrate
biodiversity study data is shown below. 
The species and number of species observed at the 6 sediment collection sites are shown, based on the first 30 bugs found. Also, the formula for calculating the P. T. I. and quality of the stream at each site is shown. The results indicate the quality of the stream based on macoinvertibrate biodiversity is related to the concentrations of the elements in the sediments. The higher the concentration of metals in the sediments, the lesser the biodiversity and therefore the poorer the quality of the stream and vice-versa. One sediment collection site (#5) in the more industrialized portion of the stream has a lower concentration of metals similar to the concentrations in the lesser industrialized portions of the stream. This site also indicates a higher water quality as found in the less industrialized area.
The relationship of metal concentrations in the sediments, the pH of sediment water and the number of bugs in each of the three classes of macroinvertebrates is shown in the Correlation Table below.
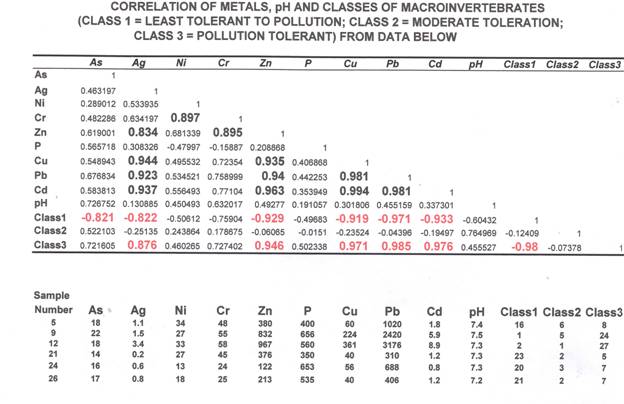
The strong relationships of the macroinvertibrates and the other variables are show by correlation numbers in red, bold type. There appears to be a strong negative relationship between the number of least tolerant to pollution, class 1 microinvertebrates living in the sediments and the concentrations of the As (-0.82), Ag (-0.82), Zn (-0.93) Cu (-0.92), Pb (-0.97) and Cd (-0.93) in the sediments. This is expected since the higher the metal concentrations, the lower number of class 1 (intolerant) bugs. Also, there appears to be a strong positive correlation between the pollution tolerant, class 3 bugs and Ag (0.88), Zn (0.95), Cu (0.97), Pb (0.99) and Cd (0.98). This seems to indicate an increase in the tolerant genus of bugs with an increase in heavy metals. This could mean the tolerant bug depend on these metals. The correlation between class 1 and class 3 shows a strong negative correlation (-0.98) which is expected. The low negative and positive correlation numbers of metal concentrations, and pH related to class 2 bugs indicates the number of bugs in this class are not affected or related to these 2 factors.
There doesn’t seem to be a correlation
between pH and the concentration of metals and number of bugs in the
sediment. There is a strong relationship between some of
the metal concentrations shown in bold black type. As mentioned before, there were many former
facilities built along the
CONCLUSIONS
The data obtained in this
research seems to agree with my hypothesis.
The concentration of heavy metals was higher in the stream sediments
along
ACKNOWLEDGEMENTS
I wish to thank my science teacher, Miss Lynn Vogel and my father who encouraged me to do this project. I wish to than the Geology and Chemistry Departments for allowing me to use their facilities.