Introduction and Hypothesis
Lead was banned from the use in gasoline in 1986 because of toxic conditions. For many years before 1986, gasoline emissions with lead was carried by the wind and deposited in soils near traffic areas. Lead resides in soils for a long period of time. Soils near stop light intersections should have accumulated high concentrations of lead because of the time cars waited for the stop light to change. The prevailing wind direction could help deposit the gasoline emissions in soils at certain quadrants at stop light intersections.
I believe the concentrations of lead in soils adjacent to traffic intersections are higher in samples located downwind (NE and SE quadrants) compared to the upwind samples (NW and SW quadrants). I also believe some soil samples will have higher lead concentrations than acceptable by the EPA. Also, I believe that the concentrations of lead in the soils at intersections are higher where the traffic density is higher.
Procedure
I visited the traffic engineer
of
I brought the samples to a laboratory at Missouri State. Each sample was weighed to 1.00 gram on a Sartorius analytical balance and placed in a labeled centrifuge bottle. Twenty milliliters 3N nitric acid was added to each sample bottle. Each bottle was placed in a hot water-shaker bath for 24 hours at 70 degrees Celsius and 50 rpms. The samples were centrifuged at a high speed for 4 minutes. The liquid portion of each sample was poured into a labeled analysis bottle. Element standards and blank solutions were used to determine the concentration of lead in each sample. A Varian ICP Spectrophotometer was used to determine the concentration of lead in each test and control sample.
Discussion of Results
The wind rose for the years of 1941 to
1971 and my calculations of the sum of the main directions of the prevailing
winds in
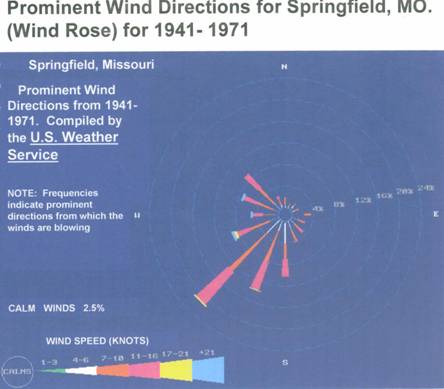
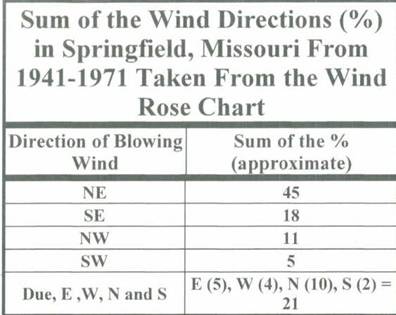
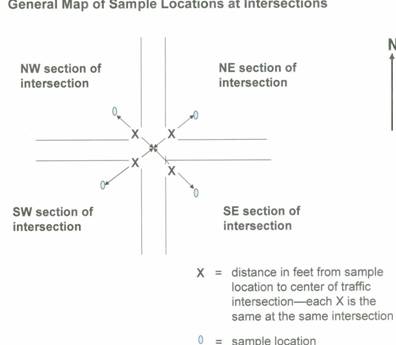
The main downwind directions of the winds are NE and SE. The pattern I used to collect the samples from each intersection is shown below.
The Table of Data from the chemical analyses of lead in the soils at the intersections is shown below.
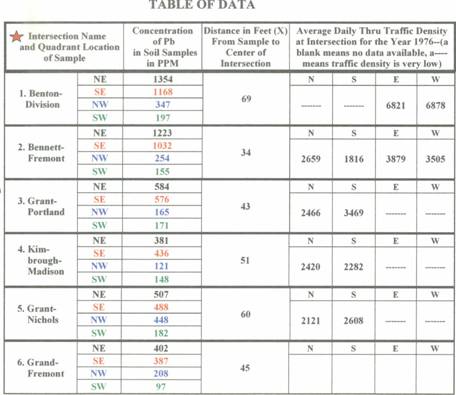
The data from the table above is shown in the bar graph below. Also, shown below is the lead concentration of the background or control used in this study.
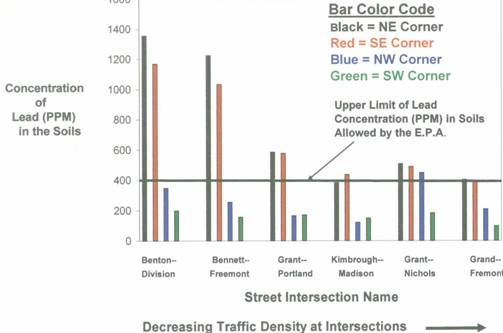
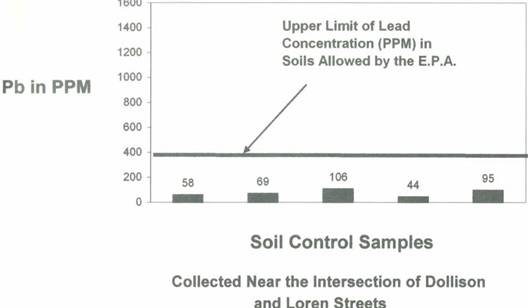
The concentrations of lead in the test soils are higher in the 2 east quadrants of the intersections (northeast and southeast). Also, the concentrations of lead are also higher at the intersections with higher traffic densities. The concentration of lead in eleven of the 24 test soil samples are above the EPA limit of 400 PPM. The concentrations of lead in the control or background samples are much lower than the concentrations of lead in the test samples.
Conclusions
The results of this research support my hypothesis. There can be problems concerning the concentrations of lead in the soils originating from wind blown gas emissions from the past. The lead concentrations in soils at daycare centers and grade schools close to major traffic intersections on the east side may contain dangerous levels of lead. Small kids at these places can become sick and have brain damage because of the high lead concentrations of lead in concentrate in the stream sediments. Lead concentrations could be ingested by smaller vertebrates or invertebrates and passed onto fish and us. I would like to do further research on this and study lead concentrations in soils at daycare centers and schools close to major traffic intersections.
Acknowledgements
I would like to thank people
at the Springfield Traffic Engineering Department for supplying me with traffic
density tables and help. I would also like to thank the U.S. Weather Service
for giving me a wind rose of the prevailing winds for