Introduction
Streams, which receive
emissions from urban areas or cities, mining areas and wastewater treatment
facilities can become contaminated with bacteria, organic chemicals, and chemical
elements including heavy metals.
Corrosion of plumbing pipes could result in emissions of heavy metals
into the streams. The use of detergents
and fertilizers could result in emissions of phosphorous into streams. Three
local streams receive emissions of materials from three separate cities. Wilson Creek drains the city of
Springfield and has been affected by wastewater overflow from a wastewater
treatment facility. The facility treats
incoming wastewater with concentrations of copper, lead, zinc and
phosphates. Pearson Creek
drains the city of Strafford and has received emissions of zinc and smaller
concentrations of lead from mining activities and mineral ore deposits located
near the mouth of the stream. Sawyer
Creek receives drainage from the city of Rogersville. Each stream is about the same length. The length of Wilson Creek is about 5.19
kilometers, that of Pearson Creek, 5.69 kilometers and Sawyer Creek, 5.68
kilometers. The channel of each stream
is located in the same geologic rock and each stream drains directly into the
James River.
The
determination of substances in stream sediments instead of stream water has
been used to evaluate the “quality” of stream systems. Concentrations of heavy metals and
phosphorous in stream sediments has been used to determine the “quality” of the
stream.
Based on the size or
population of the city, which each stream drains and the effects of other known
emissions sources on the streams, I think Wilson Creek would have higher
concentrations of heavy metals and phosphorous present in the stream sediments,
Pearson Creek the second most, and Sawyer Creek the least concentrations of
these metals. I also think the trend of
the concentrations of these elements along the stream course could define and
verify specific known emission sources. Examples would be higher zinc
concentrations near the mouth of Pearson Creek because of the presence of zinc
mines upstream from that location or higher P concentrations downstream from a
wastewater treatment facility on Wilson Creek because of past wastewater
overflow.
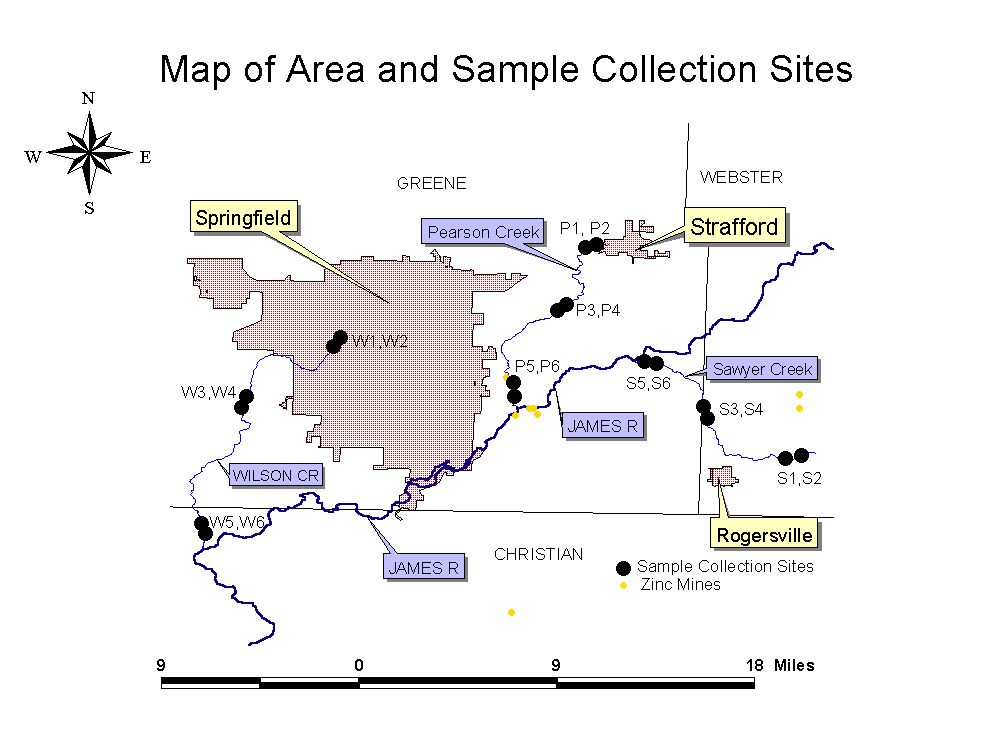
I used road maps and
collected six sediment samples from each stream mentioned above. Two samples were collected near the
headwaters, two from the center, and two from the area near the mouth of each
stream. Each sample pair was collected
approximately 50-100 feet apart. All
samples were collected from the stream with the use of a hand hoe and placed in
labeled plastic sandwich bags.
All
samples were dried and disaggregated with a mortar and pestle. Each sample was passed through a 63- mesh
sieve screen. A portion of each sample
weighing approximately 0.5000 grams was added to a centrifuge bottle. Ten milliliters of 3N nitric acid was added
to each bottle. The bottles were placed
in a hot water bath and shaken at 80 degrees C for 12 hours. All bottles were centrifuged and the liquid
portion of each sample was placed in an analysis bottle for chemical analysis.
The
concentration of copper, lead and zinc in each sample was determined with the
use of the Shimadzu Atomic Absorption Analyzer. The concentration of phosphorous in each sample was determined
with the use of a Varian 150 AX ICP Emission Spectrophotometer. The concentration (PPM) of each element was
recorded. Microsoft Word and Excel
were used to aid in the presentation of the data for this project.
The location map of collection sites along the streams is
shown. The concentrations of all elements in the
sediments of the three streams are shown in table 1. The mean
concentration of each element in each stream is shown in the next
table. The trend chart for copper concentrations in the
sediments is shown. The concentrations
of copper appear to be highest at the headwaters of Wilson Creek. This is the closest proximity of stream to
the city of Springfield. The
concentrations of copper display a decreasing value with distance along Wilson
Creek.
The trend
chart for lead concentrations in the sediments is shown. The concentrations of lead are highest at
each headwater area and decrease downstream with distance except for the two
samples near the mouth of Pearson Creek.
The high values of lead could be caused by the emission of metal present
in small amounts in the ore mines located upstream from these two samples.
The trend chart for zinc concentrations in the
sediments is shown. The concentration
of zinc is greatest at the headwater area of Wilson Creek. The same is not true
for zinc concentrations at the headwaters of Pearson and Sawyer Creeks. The concentration of zinc increases abruptly
in the samples near the mouth area of Pearson Creek. I believe this is due to the presence of the zinc mines located
in a close proximity upstream.
The trend chart for the phosphorous concentrations
in the sediments is shown. The
concentrations in the sediments of Wilson Creek appear to increase downstream
from the headwaters with a large increase in the sediments near the mouth. This could represent the emissions of P by
the wastewater treatment facility located between the middle and mouth portions
of this stream. The P concentrations
show a decreasing trend in Pearson Creek from the headwaters to the mouth. As mentioned before, the mean concentration of each element in the
sediments in each stream is shown.
The concentration of all metals is highest in Wilson Creek, second
highest in Pearson Creek, and lowest in Sawyer Creek.
The concentrations of
elements in the sediments of the study streams appear to be affected by a few
factors. These include population
density and total area of the city, ore mines in the area and a wastewater
treatment facility. The concentrations
of all elements were highest in the sediments of Wilson Creek, next highest in
Pearson Creek, and lowest in Sawyer Creek.
All of the above observations were the same as in my original
hypothesis. From the results I could
say Sawyer Creek is cleanest, Pearson Creek next cleanest, and Wilson Creek the
least clean. However, I know the
concentrations of other substances must be included before this judgment is
made.
Acknowledgements
I wish to thank my father who was my mentor and supervisor
in this project. He also helped me to
clarify and edit this report. I also
wish to thank the Chemistry and Geography, Geology and Planning Departments at
Missouri State for the use of their facilities and equipment. I also wish to thank my teachers at St. Agnes Elementary for
their encouragement and guidance.