Scarcity, Opportunity Costs,
and Basic Economic Questions
I. Graphical Analysis
A. The student needs a basic
understanding of graphical analysis to be able to learn
economics. There are three basic methods of discussing
economic models and concepts: (1) verbal discussions, (2)
graphical analysis, and (3) mathematical analysis.
Mathematical analysis is an extremely important tool in
economics. However, at the principles level only basic
mathematical tools (algebra) are used and then only
occasionally. Principles will rely mostly on the first two
methods for teaching economics with a special emphasis on
graphical analysis.
Students cannot learn
economic principles without a basic understanding of
graphical analysis. However, it is generally assumed that
students will have learned the elements of graphical analysis
prior to the class. If you have a problem with graphical
analysis you must get spend some time making sure you
understand how to use and understand graphs.
B. The graphical
analysis that will be used in the class will rely upon the
Cartesian coordinate system. This system is shown in the
graph below. There exist two variables, x and y, which may
both take either positive or negative values. Any specific
pairs of values for x and y can be represented on the graph
by a single point. For example, the origin occurs where the x
and y axis cross. At the origin both the x and y variables
equal zero. As x moves to the right on the graph, it gets
larger in value and the reverse as it moves to the left.
Similarly, as y moves up on the graph, y gets larger in value
and the reverse as y moves down. So point A represents y
equal to five and x equal to negative 5.
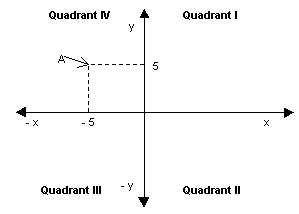
Finally, notice that the
Cartesian coordinate system divides the graph into four
separate areas, known as quandrants. Each quandrant is
defined by the values of x and y. For example, in quandrant
I, both x and y are positive, while in quandrant III, both x
and y are negative. In principles of economics, we mostly
work in quandrants I and II. As a result we draw graphs that
only show these quandrants, sometimes only quandrant I and
sometimes both quandrant I and II.
C.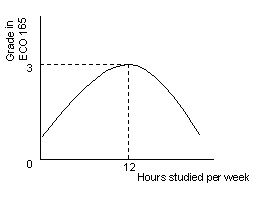 The major use of graphs, and graphical
analysis, in this class will be illustrative. To do well in
the course, the student should be able to quickly grasp the
meaning of a given graph. For example, what information does
the graph to the right convey?
The major use of graphs, and graphical
analysis, in this class will be illustrative. To do well in
the course, the student should be able to quickly grasp the
meaning of a given graph. For example, what information does
the graph to the right convey?
First, consider the variables
on the axes. On the x axis is the number of hours studied per
week for our class, Economics 165. This variable can be no
less than zero. That is, the least amount of time this
student can study per week is zero. On the y axis, is the
grade obtained in the class. Just as with study time, the
lowest the grade (on a 4.0 scale) that can be earned in any
class is zero. Hence, both of the variables on the graph must
be greater than or equal to zero. We can conclude that the
graph represents only quadrant I of the Cartesian coordinate
system, as described in B. above.
Second, carefully consider the
information conveyed by the graph. The main point of graphs
is to convey information about the relationship between the
two variables on the axes. This particular graph tells us all
of the following about the relationship between the number of
hours studied per week and the grade obtained in the class:
1. As students do not have
identical abilities or backgrounds, this graph can only
convey information about a single student. It is
important to realize that not all students will have
exactly the same relationship.
2. Notice that initially
as the number of hours studied per week increases that
the grade in the class increases as well. However, the
grade reaches a maximum at 12 hours and thereafter falls
as hours per week increase. Thus, the maximum grade this
student can possibly receive is a B. Other students with
different abilities will have a different maximum, either
higher or lower.
3. The curve intercepts on
the y-axis, at about .7. This means that if this student
did not study at all, he would receive a .7, which
translates into a D- on a 4.0 scale. Thus, this student
can receive a passing grade without any studying. Other
students, again, might get either a higher or a lower
grade with no effort.
4. The concave (concave
means bowed out from the origin) form of the curve,
implies that initially an hour studied returns a large
increase in the grade, but eventually the return gets
smaller and, past 12 hours, even yields a decrease in the
grade. Does this relationship seem realistic to you? Is
the first hour you study more likely to have a larger
positive impact on grades than later hours studied? In
fact, it is common for variables to exhibit this type of
relationship. It is so common that economists have named
it a law, the law of diminishing returns.
This particular graph is not
important for the class, except as an example of graphical
analysis. Students should learn to quickly look at graphs and
understand the information contained in the graph. A student
once told me in my teacher evaluations something like
"Dr. Olsen is also droning on about some graph or
another." It is true that this class relies heavily upon
graphs and if you cannot understand the graphs then you will
be lost, do poorly in class, and also think it boring.
Students need should review their graphical skills and
request help if they are lost. A good source for such review
is the student study guide, in the appendix to chapter 1.
II. Basic Economic Definitions
The first step in the course is to
understand some basic definitions, to be used throughout the
course of the semester. Some of the definitions will be modified
slightly later in the course; once more background information is
gained.
A. Economics.
What is economics? When I ask
students who have not already taken an economics class this
question, they often focus upon money and financial
institutions. Sometimes, it is described as dealing with
questions like unemployment and inflation. Although all of
these answers are correct, in that these are issues that
economists analyze, economics itself is much broader in
application.
Economics is
the study of the choices that people make, all of the
choices, and the personal and social consequences of those
choices.
It is easy to see that
economics is relevant for the topics discussed above, but
also for a wide range of other types of issues not normally
considered by most people to be economic in nature. For
example, economist Gary Becker first suggested more than
twenty years ago that the choices that people make in families
could be fruitfully analyzed with economic principles and
procedures. His treatise on the family was primarily the
reason why he was awarded the Nobel Prize in Economics in
1992. Economics considers an extremely wide range of topics
ranging from explaining divorce to investigating the working
of the law and legal institutions.
B. Microeconomics vs.
Macroeconomics
Micro and macroeconomics are
the two main branches of economics. In each branch, it
remains the case that what is being studied is the choices
that people make, and the personal and social consequences of
those choices. However, the particular types of choices being
studied vary between the two branches.
As the word implies, macroeconomics deals
with the large, or aggregated, economic choices faced by
society. Thus,
macroeconomics studies issues dealing with an aggregated,
national or regional economy such as matters of unemployment,
inflation, levels of government spending and taxation, and so
forth.
In contrast, microeconomics deals
with small, sometimes individual, economic choices faced
within any society. Thus,
microeconomics studies issues dealing with smaller choices
including individual choice by consumers, the behavior of
profit maximizing firms in different types of market
scenarios, and other types of non-market organizations, such
as the family.
C. Scarcity
We have already decided that
economics is a study of choices, either collective
societal choices or more individualized choices. However,
what is it about the real world that requires that we make
choices? A moment’s thought about our individual lives,
and the choices that we face, reveals that we must make
choices because we have limited resources.
Scarcity is
simply the concept that human wants (not human needs)
exceed the resources available that are necessary to produce
the goods used to satisfy those wants.
Thus, scarcity is
fundamentally the most important concept in economics, upon
which all of the rest of the discipline rests. For without
scarcity, no need for choice, either individual or
collective, exists. One need not make a choice between buying
a nice lunch at a restaurant and buying a new sweater because
one will always have enough resources to purchase both goods.
Since economics is the study of how people make choices,
without scarcity there would exist no choice and, hence, no
economics.
Thus, scarcity is one of the
fundamental premises of economics. However, scarcity is not
necessarily universally true, especially for all times, all
places, and all goods. Thus, a given good at a specific place
or time might not be scarce. Thus, we must define what we
mean, not only by scarcity in general, but by scarcity for
specific goods.
A good is
considered scarce if the amount people demand of the
good (quantity demanded) exceeds the amount that is supplied
(quantity supplied), when the price of the good equals zero.
A good is
considered free if the quantity demanded either
equals or is less than the quantity supplied, when the price
of the good equals zero.
In other words, a good is not
scarce if enough of the good is freely available at a zero
price. The definitions of scarce and free goods depend upon
the price of the good, which must equal zero to determine
whether the good is scarce or free. However, this does not
mean that the price must equal zero before one can determine
whether or not a good is scarce.
Consider, for example, a good
that is free. We already know that this good has quantity
demanded less than or equal to quantity supplied when the
price of the good equals zero. What happens to the
relationship between quantity demanded and quantity supplied,
for this free good, as the price of the good rises from zero?
After reflection on their behavior, most people will
recognize that they will buy less of the good as the
price rises, all else equal. Likewise, as the price rises,
suppliers of a good will tend to be willing to supply more of
the good, all else equal. However, at a zero price there was
already more than enough of the good available for those who
wanted to consume the good. Therefore, as the price rises
this excess supply of the good available will only increase.
However, in a free market (one with no government
interference in the market) no one will be willing to pay a
more than a zero price for this good because they can get all
they want when the price is zero. It is only when the good is
scarce at the zero price that people will be willing to pay a
higher price. In this case, there will not be enough of the
good to go around and the people who are not lucky enough to
obtain it will try to get it by offering a higher price for
the good.
Thus, one can look at the
price that occurs for a good in a free market to determine
whether or not the good is free or scarce. If a positive market
price exists, then the good must be scarce. However,
if the market price is zero, then the good must be free.
D. Production
The following
flow diagram describes what economists mean when they talk
about production.
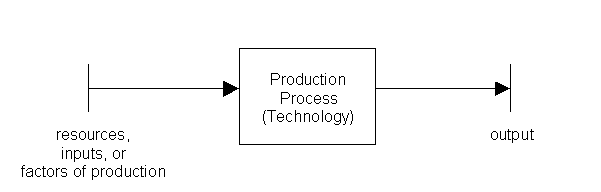
Resources are inputted into a
production process, which yields an output. The production
process itself embodies the technology used to produce the
output. An increase in technology will make it possible to
produce more output with the same level of resources or make
it possible to produce the same output with fewer resources.
There are four general types of resources:
Type of Resource
|
Abbreviation
|
Return
|
Labor
|
L
|
wages
|
Land (natural resources)
|
N
|
rent
|
Capital
|
K
|
interest
|
Entrepreneurship
|
E
|
profit
|
Labor is often referred to as
"human capital," an acknowledgement that labor
resources are often made more productive through education or
training. Capital is one of the most confusing types of
resources, largely because many students think of Capital as
primarily financial rather than as a productive resource.
However, not only is Capital a productive resource, but it is
also always itself the result of a production process.
Land is an inclusive category that includes all kinds of
natural resources. The only condition that must be met is
that the resource cannot be the result of a production
process, which would make the resource Capital rather than
Land. Entrepreneurship is really just a particular type of
Labor, that type of labor that organizes all of the other
resources in a productive enterprise. As a result,
Entrepreneurs receive profit – the amount of money that
is left after all other resources have been paid.
E. Rationality
As noted above, scarcity
implies that humans and human organizations must make
choices. However, one of the crucial questions that must be
answered, in order to investigate how people make choices, is
the underlying goal followed by individuals. Economists assume that
individuals are rational, that they make choices in order to
maximize their own self-interest. Rationality may seem to be a rather narrow
assumption. However, self-interest actually has quite a broad
application because each individual can, obviously, define
the limits of their own self-interest. Thus, for many people,
their own self-interest includes quite a broad range of
people or issues including, for example, their own families.
F. Basic Economic
Choices/Questions
All economies face four basic
choices, questions that must be answered for an economy to
work well.
1. WHAT
goods will be produced?
Initially society must
decide what goods, specifically, they wish to produce.
2. HOW will
resources be used in the production process?
Once it has been decided
exactly what goods will be produced, the next question
that must be addressed is exactly how these goods will be
produced. This question focuses on issues such as the
type of technology to be used, whether the production
process should be labor intensive or capital intensive,
and so forth. The most important focus for economists is
on the issue of producing output with the fewest
resources or the lowest costs.
3. WHO will
receive the goods?
Once the goods have been
produced, the next crucial question that remains deals
with who, specifically, will get these goods. In a market
economy, which replies upon money for many transactions,
this question is essentially one of determining the
distribution of income. Higher income, in a market
economy, translates into the ability to purchase more
goods and services. Thus, this question focuses on issues
of taxation and subsidies.
4. When will
production occur?
The final question deals
with the timing of production. Sometimes the timing of
production is determined by nature, as in the case of
many agricultural products that are produced in a
particular season. This leads us directly to another
relevant issue for this question, the storage and wastage
of perishables. For, while many goods can only be
produced in a particular season, most often consumption
of those goods takes place during the entire year.
Sometimes the timing of production is determined by
society. For example, in Western society the largest
season for retail sales occurs just prior to Christmas.
G. Opportunity Costs
An opportunity
cost equals the value of the next-best foregone alternative,
whenever a choice is made.
Again, notice the common theme
of the necessity of choice, and its consequences, running
throughout all of these definitions. Economists are careful
to consider all of the costs of making a choice.
Consider, for example, the choice made by all of the students
in this class, the choice to attend school. The costs of
attending school can be divided into direct costs and
indirect costs. Direct costs are actual, out-of-pocket
payments for goods, services, or resources. Indirect costs
are, on the other hand, the opportunity costs of goods,
services, or resources that are consumed, even though no
direct payment for them occurs. Carefully consider the costs,
both direct and indirect (opportunity), of your choice to
attend school. Let’s suppose that they look something
like the following:
The Cost of Attending College
|
Item
|
Cost
|
Type of Cost
|
Tuition and fees
Residents
Non-residents
Room and
Board
Books and
Supplies
|
$3,214
$6,154
$3,594
$600
|
Direct
Direct
Direct
Direct
|
Lost Wages
Lost Interest
Lost Rent
Lost Profit
|
$6,592
$652
$5,102
$8,100
|
Indirect
Indirect
Indirect
Indirect
|
| Note:
The Direct costs are yearly figures for Missouri State charges for
each item. The Indirect costs are examples only. |
The above includes both types
of costs, direct and indirect. The direct costs are fairly
straightforward, representing the dollar payments charged for
goods many students must buy. However, the indirect costs
require more explanation. These all represent, as given in
the definition of the term "opportunity costs"
above, not direct out-of-pocket dollar payments, but the
value of foregone alternatives. For example, lost wages refer
to the wages that a student loses because he chooses to
attend college. Any resource can have an indirect cost
associated with it, not just labor. For example, a person
could have $10,000 that she uses to finance the direct
payments for college. However, she could have used
this money as an investment, which would have yielded
interest payments. The interest that she loses as a result of
this decision is also a cost of attending college, albeit an
opportunity cost.
It is important to note that
each individual’s total costs of attending college will
vary because their choices and situation varies. For example,
one person may bear none of the indirect costs because they
had no other options besides attending college, at least none
that involved such dollar losses. Another person may have
lost wages, which may be quite low, while a second’s
lost wages might be quite high because they have different
opportunities. Hence, one cannot simply add up all the
numbers in the table above to discover the total cost of
attending college for each individual.
Finally, only indirect
costs are considered opportunity costs.
H. Monetary Price versus
Relative Price
The monetary
price of a good or resource is simply the actual dollar price
paid. Other terms for the
concept of "Monetary Price" are "Absolute
Price" and "Nominal Price."
In contrast to the monetary
price, the
relative price measures the price of the good or resource
relative to prices of other goods and resources. Thus, the relative price of a good or
resource can either (1) remain unchanged even though its
monetary price rises or falls or (2) rise or fall even though
its monetary price remains unchanged. This is true because
relative price can change, not only because of changes in the
monetary price of a good or resource, but also because of
changes in the monetary prices of other goods or resources.
Consider, for example, the
price of oranges relative to apples when both cost $1 per
pound. If the dollar price of oranges rises to $2 per pound,
then both of the above situations are possible dependent upon
what happens to the price of apples. If the price of apples also
rises to $2 per pound, then the relative price of oranges has
not changed. This is because giving up one orange will still
buy one apple, and the reverse, just as it would before the
monetary prices changed. However, if the price of apples does
not change, then oranges have gotten more expensive
relative to apples. Before the price change, one could buy
one apple or one orange with a dollar. After the price
change, one could buy one orange or two apples with the same
amount of money.
Now that we understand the
meaning of these two different types of prices, the next step
is to consider which of the two concepts, monetary or
relative price, is used by individuals as they make their
consumption decisions. To illustrate the answer to this
important question consider whether your behavior
would change if all prices doubled, including the
price paid for your labor and other resources. In other
words, all the prices you pay for goods you consume would
double as would your income. In this case, although monetary
prices have changed, relative prices for all goods and
resources remain unchanged. When faced with such a scenario,
most people do not change their behavior. This serves as an
indication that it is relative price, and not monetary price,
that matters in individual decision making.
Finally, prices in a market
economy have some additional functions. For example, the
price of a good or resource conveys information about the
availability of the good and, often, its quality. Prices also
serve as an incentive to individuals in their decision
making. Higher prices give people an incentive to ration
scarce goods and resources.
I. Economic Efficiency
For society as
a whole, economic efficiency is achieved when society
produces the output of goods such that society’s highest
net value is obtained.
Net value
equals the difference between the total benefit society reaps
from all the goods currently being produced and the total
costs of producing those goods.
The concept of economic
efficiency can be broken down into two types of efficiency,
technological and allocative efficiency, both of which must
be achieved in order to achieve economic efficiency.
Technological efficiency
focuses on answering the basic economic question of how
goods and resources will be produced. That is, it focuses on
the question of what production process (i.e., what
technology) should be used in order to produce a given
output, with the goal being to maximize society’s net
value. A
production process is considered technologically efficient
if, given the output being produced, the fewest resources
possible are used to produce that output. Technological inefficiency is the
result when this goal is not achieved.
The above is not the only
possible definition of technological efficiency. A production process
would also be considered technologically efficient if, given
the resources being used, the maximum possible output is
gained from those resources. These two definitions for technological
efficiency do not contradict each other, but are just two
different ways of looking at the same problem – how
should production occur.
Allocative efficiency focuses
on answering the basic economic questions of what to
produce and who will receive those goods. That is, it
focuses on the question of the efficient allocation of
resources into different productive enterprises. At our
current level of understanding, the definition of allocative
efficiency will rely upon mutually beneficial exchanges. An
exchange is considered to be mutually beneficial, if at least
one of the parties to the exchange is benefited by the
exchange and no one is damaged by the exchange, including
parties who are external to the exchange.
Consider the following example
to illustrate the concept of mutually beneficial exchanges.
Suppose individual A builds a house, which he values at
$100,000. Individual B, however, values the house at
$150,000. Does some price exist by which A can sell the house
to B and have at least one, or both, of the parties better
off? The answer to this question is obviously yes. For
example, an exchange price of $125,000 would leave both
A and B better off. A would be better off because she sold a
house worth only $100,000 to her at a price of $125,000, a
net gain of $25,000. B would be better off because he gave up
$125,000 to buy a house worth $150,000 to him, a net gain of
$25,000. Further, since both A and B are members of society,
society is also better off, by a total of $50,000, assuming
that the exchange does not damage anyone else.
Now that the concept of
mutually beneficial exchange is well understood, allocative
efficiency can be defined. Allocative efficiency occurs when all
possible mutually beneficial exchanges have taken place. If any potential mutually
beneficial exchanges do not occur, then allocative
inefficiency occurs.
As noted above, both
allocative and technological efficiency must occur for
society to be economically efficient.
J. The Scientific Method
People are often confused
about which disciplines can legitimately be considered
science. Are those who study English, for example,
scientists? What about economists, are they scientists? To
many only those disciplines included in the so-called
"hard" sciences, such as biology and physics,
should be considered scientists. However, for the purposes of
this class we will consider a discipline a science if it
follows the scientific method in its academic inquiry.
What is the scientific method?
The scientific method is a process that attempts to
objectively learn truth about the real world. It has three
major components:
1. Initial identification
of a real world problem to study.
In this step, the
scientist looks at the real world to find some phenomenon
that she thinks explaining will yield fruitful insights.
For example, one problem that economists have addressed
is how markets, with buyers and sellers, work. In
addition to identifying the problem to study, in this
stage the scientist also thinks about the nature of the
problem and, perhaps, makes ad hoc observations that will
help him formulate a method of modeling the problem,
which is the next step of the process.
2. Build a model of the
real world problem being studied. Model building includes
the following three steps.
The first step is to make
some assumptions that will serve as the foundation upon
which the model is built. Assumptions serve two crucial
purposes. Most importantly, they attempt to mimic the
real world conditions that affect whatever problem is
being studied. However, the real world is often too
complex to include all of its components within a
scientific model. As a result, assumptions are often made
in order to simplify the model, as opposed to reality,
which has the benefit of making the model easier to
understand and use. The key in this step of the process
is to not make simplifying assumptions that are so far
removed from reality that the model is incapable of
providing insight into the problem under consideration.
The second step is to
build a model or theory based upon the assumptions the
scientist has made that describes the phenomenon being
studied. Most of the time, mathematics is used to build
scientific models.
The final step in the
model building process is to use the model to get
predictions about how the real world behaves. For
example, one of the key purposes of building a model
describing how markets work is to predict what will
happen in different circumstances to prices and
quantities exchanged in a given market.
3. The final step in the
scientific method is to test the model. The scientist
uses the predictions developed in step 2 above, gather
real world data, and then compares actual outcomes with
the predictions. If the predictions are accurate, then
the simplified scientific model is successful. However,
when the predictions are inaccurate, the scientist must
begin over with step 1 and go through the process again
as many times as it takes until accuracy is achieved.
Economics is a science because
it uses the scientific method to analyze real world problems.
Other disciplines, like English, are not sciences because
they do not use the scientific method. This does not mean
that these disciplines are not useful to society, just that
they are not science. In this course, we will use the
scientific method to build a number of models describing real
world phenomena. Our focus will be upon building models about
how markets work and how consumers and firms make decisions.
These models constitute the principles of economics. We will
not do any systematic testing of the models, although
economists have rigorously done such testing, because such
testing is beyond the scope of the course. However, we will
discuss applications of the model to the real world to give
students some insight into the real world and to demonstrate
that the models have real world applicability.
K. Positive versus Normative
Economics or Statements
One of the crucial skills
needed by scientists is the ability to differentiate between
opinion, especially their own opinion, and facts.
Positive
economics/statements are statements about how the world actually
exists or behaves.
Normative
economics/statements are statements about how the world should
exist or behave.
Thus, positive statements are
factual while normative statements are opinions. How does one
distinguish between the two types of statements? The easiest
method to distinguish between the two is to simply ask
whether or not the statement can be tested
empirically. If the statement can be tested, then it
is positive even if it is false. However, if it cannot
be tested, then the statement must be an opinion, as opinions
are subjective and are untestable.
Consider the following
examples of statements:
1. "Read my lips. No
new taxes." George Bush asserting in a presidential
debate in 1988 that if he were elected President of the
U.S. he would not raise taxes.
2. "The minimum wage
in the U.S. should be raised."
3. "When the general
employment rate in the U.S. is five percent, unemployment
rates for blacks and other minorities are usually above
ten percent."
4. "Every Western
developed nation has a national health care system except
for the United States. The United States must follow the
lead of these other countries in providing health care
for the uninsured."
Which of these statements is
positive and which normative? George Bush’s assertion
that, if elected, he would not raise taxes turned out to be
false. He was elected and he did raise taxes. Hence, this
statement must be positive because it was, in fact,
tested. Any statement that can tested, even if the statement
turns out to be false, must be positive. Both statements 1
and 3 can be tested and, hence, are positive. The assertion
that the minimum wage should be raised is, however, an
opinion, and cannot be tested as to its accuracy. Opinions
are often, although not always, signaled by the words
"ought" or "should." Statement 4 has both
positive and normative elements to it. The first sentence,
asserting that only the U.S. does not have national health
care, is positive because the accuracy of the statement can
be checked. The second sentence, however, is an opinion and
as such is normative.
As was noted above, it is
crucial for scientists to be able to differentiate between
fact and opinion, between positive and normative statements.
If they cannot so distinguish, then the scientific method
will be compromised. That is, the scientific method requires
that the scientist check the accuracy of the model by
comparing its predictions against the real world. However, if
the scientist cannot distinguish between the real world
(positive statements) and opinions (normative statements)
this step in the scientific method will be compromised and
the method will fail. However, it is important to note that
this does not mean that scientists should not have opinions,
just that they must be careful to distinguish their opinions
from fact.
 Back to Dr. Olsen's Curriculum Page